
Prepare for your JMeter interview with our comprehensive list of JMeter interview questions. These interview questions are designed for both beginners and professionals.
Here, we will cover both theoretical as well as practical interview questions on performance testing and JMeter.
Content
Performance testing and JMeter Interview Questions
Ques.1. What is Performance Testing?
Ans. Performance testing is a non-functional type of testing in which the application’s performance is evaluated under expected or higher load. It is done before the application is deployed on production to ensure that it doesn’t crash and responds within standard/acceptable time at real load.
Ques.2. What are the different types of Performance Testing techniques?
Ans. The different types of performance testing are-
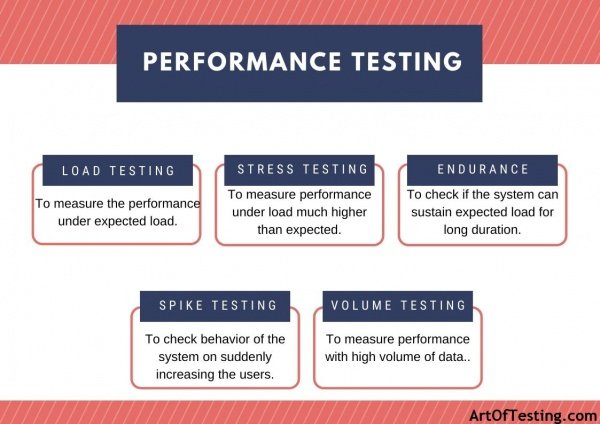
- Load Testing – Type of performance testing to measure the application behavior under the expected workload.
- Stress Testing – Evaluating the application’s behavior under load higher than the application’s threshold or peak load conditions.
- Endurance Testing – Testing application under prolonged load test, usually used to detect memory leaks in the application.
- Spike Testing – Evaluating the application’s behavior on a sudden increase in the number of users than normal.
- Volume Testing – Testing the application with a large amount of data, For instance, testing with usually with large records of data in the database.
Ques.3. What all activities are performed during performance testing of any application?
Ans. Activities performed during performance testing are-
- Performance Test Requirements Gathering & Analysis – In this phase, all the details about the application are gathered from the client and other stakeholders of the application.
- Testing Tool Selection – This phase involves the selection of the performance test tools.
- Performance Tests Planning – The test planning phase includes planning the whole performance testing process, infrastructure, and environment setup; use case scenarios to be scripted, etc.
- Test Script Implementation – In this phase, the performance test scripts are created using the tool selected in the previous phases.
- Performance Test Execution – In this phase, the test script is executed for a predefined time specified during the planning phase.
- Test Result Analysis – The result analysis phase includes consolidating the test results. Moreover, it helps in determining the different performance attributes of the application and finding the performance bottlenecks.
Ques.4. What is JMeter?
Ans. JMeter is an open-source performance testing tool developed in Java. It can be used for carrying out performance testing of web-based applications, web services(both SOAP and Rest), FTP server, Databases, LDAP server etc.

Ques.5. Why should we choose the JMeter tool for performance testing?
Ans. The advantages of using the JMeter tool for performance testing are-
- It is free to use with zero licensing costs.
- It is open-source. In other words, anyone can customize it for their specific use.
- There is good online community support and tutorials for JMeter.
- It supports performance testing of a wide variety of applications. For example – websites, web services to FTP, and Databases.
- It is easy to learn and use.
Ques.6. Explain the internal working of JMeter.
Ans. JMeter simulates real-world user load by creating multiple threads making concurrent requests to a target server. After that, it displays the performance of the server in the form of tables and graphs.
Ques.7. Does JMeter tool simulate a real browser?
Ans. No, JMeter does not simulate or function like a real browser. It cannot render HTML response like an actual browser.
Ques.8. What are some features of JMeter?
Ans. Some of the features of JMeter are-
- JMeter is 100% Java-based. So, it has all the advantages of Java-based applications like portability, extensibility, robustness, etc.
- It has a record and playback feature that ensures the easy and fast creation of test scripts.
- JMeter provides different listeners to capture and analyze the test results in both tabular and graphical format.
- It can be used to load test different protocols- HTTP, HTTPS, FTP, LDAP, TCP, etc.
Ques.9. How can we record performance test scripts in JMeter?
Ans. JMeter has HTTP(S) Test Script Recorder using which we can perform operations on a browser and the HTTP requests get recorder in JMeter.
Ques.10. Do we need to learn coding to create scripts in JMeter?
Ans. Script creation in JMeter is somewhat different from normal automated script creation. Mostly, a script can be created by recording or using JMeter UI. Followed by parameterization of tests, correlation, and configuration of different test parameters.
Having said that, coding is required in some scenarios and can be done with Beanshell scripting.
Ques.11. JMeter is Java-based. Can we use it to do performance testing of application implemented in other platforms/languages like .Net?
Ans. Yes, we can test web applications developed in other languages and platforms using JMeter.
Ques.12. What kind of applications can be tested using JMeter?
Ans. The different kinds of applications that can be tested using JMeter are-
- Websites
- Web services – REST and SOAP
- Databases(JDBC)
- Shell scripts
- FTP
- LDAP
- TCP
- SMTP, POP3, IMAP
Ques.13. Explain parameterization in JMeter?
Ans. Parameterization is the process of parameterizing the user input or other test inputs. So as to use different values for different users and loop iterations. For instance, an external CSV file can be created with multiple login credentials and then passed to the load test script in order to fetch different credentials for each iteration.
[For more details, refer to the post- Parameterization in JMeter]
Ques.14. What is correlation?
Ans. Correlation is the most important aspect of scripting in JMeter. It includes fetching dynamic data from preceding requests/calls and passing them to the subsequent requests as parameters. For example, we can extract the values of session variables from the response of the request with login details and then pass those values to the subsequent requests (thus handling the sessions). [For more details, refer to the post- Correlation in JMeter]
Ques.15. What is a Test Plan?
Ans. A Test plan in JMeter is a logical container that contains all the test elements which constitute the performance test. Some of the different elements in a test plan are – Thread Group, Samplers, Timers, Assertions, Listeners, etc.
Ques.16. What is Workbench?
Ans. A Workbench in JMeter is a temporary area of storage for the test elements. It also contains non-test elements like HTTP Proxy Server, which can be configured to record scripts via browser in JMeter. Any element placed in the workbench doesn’t get saved after with the test plan’s JMX script.
Ques.17. What is a thread group in JMeter?
Ans. A Thread Group is an element of a JMeter test plan that represents a pool of virtual users performing a set of operations.
Ques.18 What is a test fragment in JMeter?
Ans. A test fragment is a special type of controller in JMeter whose sole purpose is to provide code reusability capability in the test plan. It is like a Thread Group. But is not executed unless it is referenced by either a Module Controller or an Include_Controller.
Ques.19. What is the ramp-up period?
Ans. At the beginning of the load test of an application instead of putting all the users live, we slowly ramp up the number of users in order to study their effect in the application’s performance. In JMeter, the ramp-up period defines the time period within which all the specified users get in running state.
Ques.20. What are samplers in JMeter?
Ans. Samplers in JMeter are used for sending different types of requests to the server. Some of the commonly used samplers are – HTTP Request, JDBC Request, SOAP-XML Request, JUnit request, TCP Sampler, etc.
Ques.21. What are Listeners in JMeter? State some of the widely used Listeners?
Ans. Listeners are used for viewing, saving test results and also help in tabular and graphical analysis of the test results. Some of the widely used Listeners are – Aggregate Report, Aggregate Graph, Graph Results, View Results Tree, etc.
Ques.22. What is a JTL file in JMeter?
Ans. The test results in JMeter is saved in the form of JTL files. JTL is an acronym for JMeter Test Logs.
Ques.23. What are the different timers in JMeter?
Ans. Timers are used for halting the test execution of a thread for a certain predefined time. In addition, these timers are used for simulating the real user think time. The different types of timers available in JMeter are – Constant Timer, Gaussian Random Timer, Uniform Random Timer, Constant Throughput Timer, Synchronizing Timer, Beanshell timer, BSF Timer, etc.
Ques.24. What is the difference between the Gaussian random timer vs Poisson random timer?
Ans. Both Gaussian and Poisson random timers are used to pause the test execution for a random amount of time but close a specific value. The difference between the two lies in their underlying implementation algorithms to generate the random values.
Ques.25. What is a Rendezvous Point?
Ans. The Rendezvous point in JMeter is used to perform spike testing. It is performed using “Synchronizing Timer” by waiting until the number of active users reaches a certain specified value during the load test.
Ques.26. What are assertions in JMeter? Explain the available assertions in JMeter.
Ans. Assertions in JMeter are used for verification of certain values in the response of Sampler’s requests. The commonly used assertions are – response assertion, size assertion, XML assertion, BeanShell assertion, HTML Assertion, XPath assertion, etc.
You can also read our detailed article here.
Ques.27. What is the use of Configuration elements?
Ans. Configuration elements are used for customizing the sampler requests e.g. CSV Data Set Config can be used for parameterizing the sampler requests with values fetched from the external CSV file.
Ques.28. What are Pre-Processors?
Ans. Pre-processors are the test plan elements that are executed before the sampler request execution. Some commonly used pre-processor in JMeter are BeanShell PreProcessor, HTML Link Parser, HTTP URL Re-writing Modifier, RegEx User Parameters, etc.
Ques.29. What are Post-processors?
Ans. Post-processors are the test plan elements that are executed after the sampler request execution. Generally, post processors are used for fetching some values from the sampler response.
Ques.30. What is the order of execution of JMeter test plan elements?
Ans. The order of execution of the test plan elements is-
- Configuration elements.
- Pre-Processors.
- Timers.
- Sampler.
- Post-Processors
- Assertions
- Listeners
Ques.31. How can we run JMeter in non-GUI mode?
Ans. Command to run JMeter in non-GUI mode-
jmeter -n -t test.jmx -l test.jtl
Where,
n specifies that JMeter will run in non-GUI mode
-t for test script file
-l for jtl file having each sample’s result
Ques.32. How can we reduce the resource requirement in JMeter?
Ans. To make the best out of the available resources and in general as a practice, the following practices should be incorporated in the tests-
- Use the non-GUI mode to run the scripts : jmeter -n -t test.jmx -l test.jtl
- Use as few Listeners as possible in the test plan.
- Avoid the use of “View Results Tree” or “View Results in Table” listeners during the load test. Use them only during the scripting phase to debug your scripts.
- Rather than using lots of similar samplers, use the same sampler in a loop. Also, make use of variables (using CSV Data Set) to vary the samples.
- Don’t use JMeter’s functional mode during your performance test executions.
- Use CSV output rather than XML as it is much lighter.
- Only save the data that you are going to need.
- Use as few Assertions as possible during the load test.
[ source: JMeter Best Practices by Apache]
Ques.33. What is 90% line in JMeter?
Ans. The aggregate report listener has 90% line as one of the metrics. The Apache JMeter manual describes 90% line as- “90% of the samples took no more than this time”. It is actually the 90 percentile of the response times of the samples –
90 percentile = (90/100)*N+1/2 where N is the number of samples
So, if there are 10 samples then 90%line will be 9.5 or 9. It means the 9th value in the sorted list of samples (sorted according to ascending order of their response times).
Ques.34. What is distributed load testing? How can it be achieved in JMeter?
Ans. Distributed load testing is the process using which multiple systems can be used for simulating the load of a large number of users. The reason for using more than one system for load testing is the limitation of a single system to generate a large number of threads (users).
In JMeter, we can do distributed load testing using the master-slave configuration.
[For complete steps to perform distributed load testing refer to the post- Distributed load testing in JMeter].
Ques.35. Is it possible to run Selenium scripts in JMeter?
Ans. Yes, with the help of the WebDriver Set plugin, we can run Selenium Webdriver scripts in JMeter.
Ques.36. What is the role of the ‘Backend Listener’ in JMeter?
Ans. The ‘Backend Listener’ in JMeter allows real-time data visualization by sending metrics to external monitoring tools like Grafana or InfluxDB. This facilitates live monitoring of test executions, enabling testers to observe performance metrics as the test runs and make timely decisions based on the observed behavior.
Ques.37. How can you implement custom scripting in JMeter?
Ans. JMeter supports custom scripting through components like the ‘JSR223 Sampler’ and ‘BeanShell Sampler.’ These samplers allow the execution of custom code written in languages such as Groovy, JavaScript, or BeanShell, providing flexibility to perform complex operations, manipulate variables, and enhance test scenarios beyond standard capabilities.
Ques.38. What is the function of the ‘HTTP Cache Manager’ in JMeter?
Ans. The ‘HTTP Cache Manager’ in JMeter simulates the browser caching mechanism by storing copies of previously retrieved resources. This helps in mimicking real user behavior more accurately, as it reduces the load on the server by preventing repeated requests for the same resources, thereby providing a realistic assessment of performance.
Ques.39. How can you handle embedded resources in JMeter requests?
Ans. JMeter can automatically retrieve embedded resources such as images, CSS, and JavaScript files by enabling the “Retrieve All Embedded Resources” option in the HTTP Request sampler. This ensures that the test simulates real browser behavior more closely, providing a comprehensive evaluation of the server’s performance under load.
Ques.40. What is the significance of the ‘Scheduler’ in a JMeter Thread Group?
Ans. The ‘Scheduler’ in a JMeter Thread Group allows testers to define specific start and end times for test execution. By enabling the scheduler, one can control the duration and timing of the test, facilitating the simulation of real-world usage patterns and ensuring that performance assessments align with expected user behavior.
Ques.41. How does JMeter support testing of WebSocket protocols?
Ans. While JMeter does not natively support WebSocket protocols, it can be extended with plugins such as the ‘JMeter WebSocket Sampler’ to test WebSocket services. This enables the performance testing of applications that utilize WebSocket communication, ensuring that they can handle the expected load and function correctly under stress.
Real-world Scenario-based Performance Testing Interview Questions
Ques.42. How would you handle a situation where the application performs well during performance testing but slows down in production?
Ans. To address this, we can follow the below steps-
- Environment Comparison: Ensure the performance testing environment mirrors the production environment in terms of hardware, software, network configuration, and user load.
- Data Volume: Check if the test scenarios accounted for production-like data volumes.
- User Behavior: Analyze whether real user behavior, such as think times and concurrent actions, was accurately simulated.
- Background Jobs: Investigate background processes or jobs that may be affecting production performance but were not considered during testing.
- Monitoring: Use APM tools (e.g., Dynatrace, New Relic) to identify bottlenecks in production.
- Load Balancing and Caching: Verify if the production’s load balancing and caching mechanisms are functioning correctly.
Ques.43. What would you do if a critical performance issue is found just before a major release?
- Immediate Action: Escalate the issue to all stakeholders, including developers and management.
- Root Cause Analysis: Perform a quick root cause analysis using logs, monitoring tools, or profiling.
- Mitigation Plan: Suggest temporary workarounds, such as scaling resources, limiting functionality, or optimizing specific queries.
- Risk Assessment: Assess the impact of the issue on users and business to decide whether the release can proceed with known limitations.
- Re-Test: Once a fix or mitigation is implemented, conduct focused performance testing to ensure the issue is resolved.
Ques.44. How would you test a system that is expected to handle high traffic during a one-time event, such as a Black Friday sale or Flash Sale?
- Traffic Pattern Analysis: Understand the expected user load, peak traffic times, and transaction types.
- Capacity Planning: Collaborate with infrastructure teams to ensure adequate scaling and resource provisioning.
- Stress and Spike Testing: Conduct stress tests to identify system breaking points and spike tests to simulate sudden traffic surges.
- Caching Strategy: Verify caching mechanisms to reduce server load.
- Monitoring Setup: Set up real-time monitoring and alerting tools to track system health during the event.
- Fallback Mechanisms: Test fallback mechanisms, such as queuing systems or “static mode,” to handle overload gracefully.
Ques.45. During a performance test, you observe inconsistent response times. How do you investigate this issue?
- Resource Utilization: Check CPU, memory, disk I/O, and network usage on the servers to identify resource bottlenecks.
- Garbage Collection: Analyze GC logs if the application uses Java to identify pauses caused by memory management.
- Database Performance: Investigate slow database queries or locking issues.
- Third-Party Dependencies: Check the performance of external APIs or services the application relies on.
- Test Setup: Ensure there are no issues in the testing tool setup, such as network latency or misconfigured load generators.
- Code Profiling: Use profiling tools to pinpoint code-level inefficiencies.
Ques.46. How would you test the performance of a real-time chat application?
- Concurrent Users: Simulate a high number of concurrent users sending and receiving messages.
- Message Delivery Latency: Measure the time taken for messages to be delivered to recipients.
- Scalability: Test the application’s ability to scale with increasing user numbers and message volumes.
- Server Load: Monitor CPU, memory, and network usage on the chat server during the test.
- Network Conditions: Test under varying network conditions, such as low bandwidth and high latency.
- Persistence: Verify the performance of message persistence mechanisms, such as database writes or file storage.
Ques.47. A web application is slow only during specific times of the day. How would you troubleshoot this?
- Usage Patterns: Analyze user behavior during the affected times to understand the load.
- Batch Jobs: Check for background batch jobs or database maintenance tasks running during those times.
- Content Delivery: Verify the performance of CDNs or caching mechanisms.
- Database Contention: Look for database locks or contention caused by increased query volume.
- Infrastructure Load: Monitor server utilization metrics to identify resource exhaustion.
- Third-Party Services: Ensure external services the application depends on are not causing delays.
Ques.48. How would you test the performance of an API that has a dependency on another slow API?
- Mocking: Use mocks to simulate the slow API with realistic response times.
- Caching: Verify if the API under test implements caching to reduce dependency on the slow API.
- Timeouts and Retries: Test the behavior of the API under test for timeouts and retries.
- Load Testing: Simulate concurrent requests to evaluate the impact of the slow API on overall performance.
- Error Handling: Validate how the API handles delayed or failed responses from the slow API.
Ques.49. How would you test the performance of a mobile application with different network speeds?
- Network Simulation: Use tools like Network Link Conditioner or Charles Proxy to simulate varying network conditions.
- Bandwidth Utilization: Measure the app’s bandwidth usage under different scenarios.
- Offline Mode: Test the application’s behavior in offline mode or with intermittent connectivity.
- Background Tasks: Assess the impact of background synchronization on performance.
- Device Variations: Test on multiple devices with different hardware configurations.
Ques.50. How can you identify and address memory leaks during performance testing?
Ans. Identifying and addressing memory leaks involves-
- Run Long-duration Tests: Conduct endurance or soak testing to observe memory usage over time.
- Monitor Heap Usage: Use tools like JMeter or APM tools to monitor memory consumption.
- Analyze Garbage Collection Logs: Check if unused objects are not getting collected.
- Fix Code Issues: Collaborate with developers to fix unclosed resources or excessive object retention.
This completes our article on JMeter interview questions. I hope these interview questions will help you with your interviews.